
 By Christian Hayes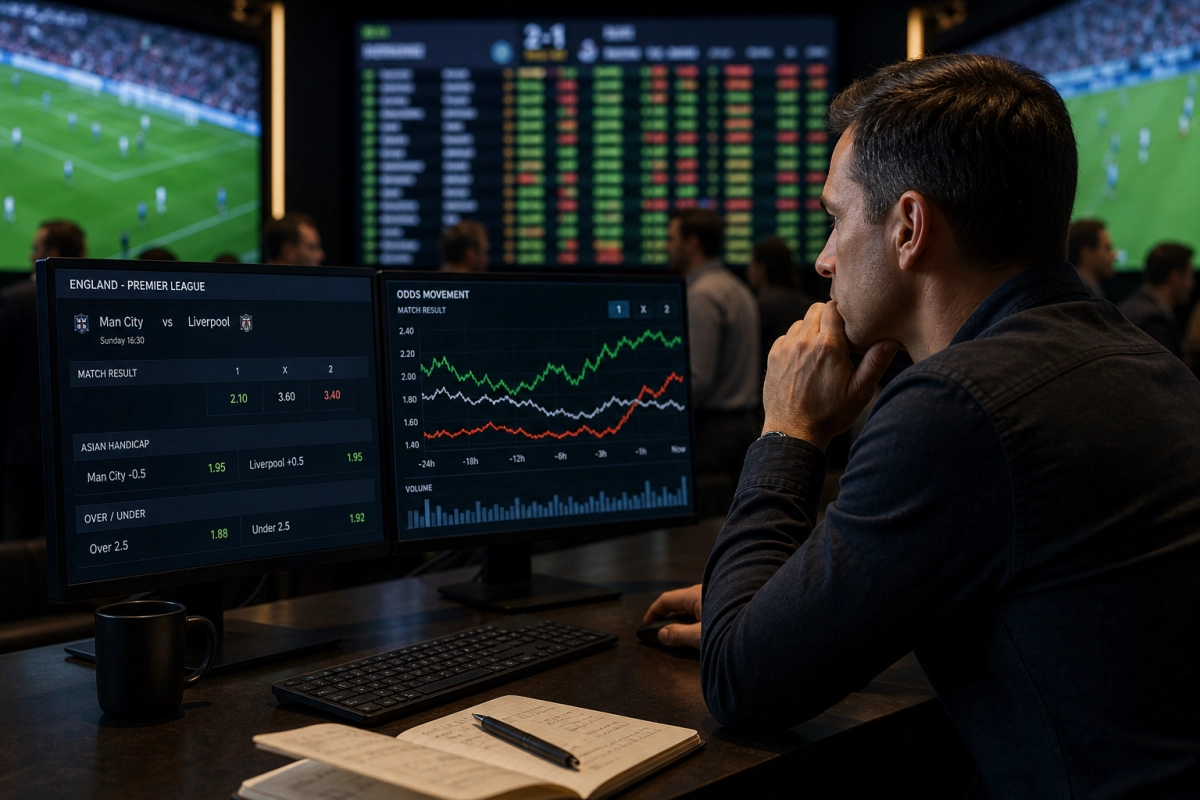
Betting markets explained: why lines open where they do and how they move
What sets the opening line and how bookmaker margin works
Bettors often see an opening price and assume it reflects pure probability. In reality the opening line is a blend of statistical models, bookmaker risk limits, and the margin (the “vig”) priced in to ensure profit over many events. Explaining betting markets explained means starting with two definitions:
- Opening line: the first publicly available odds put out by a bookmaker, based on internal models, traders’ opinions and early market signals.
- Bookmaker margin (vig): the amount by which the sum of implied probabilities exceeds 100%, representing the bookmaker’s built‑in edge.
Quick example: a football match where Bookmaker A lists Team X at 1.80 and Team Y at 2.00. Implied probabilities: 1/1.80 = 55.56% and 1/2.00 = 50.00% — total 105.56%. The excess 5.56% is the margin that protects the book.
Opening lines vary between firms because each uses different models, exposure limits, and anticipated customer profiles (casual vs professional). For bettors, comparing multiple opening lines is the first step in spotting potential value.
How money flow, liquidity and news push lines — sport examples and quick checks
Odds move when new information or money changes a bookmaker’s expected liability. Distinguishing public money from sharp money and understanding market liquidity helps interpret those moves.
Public vs sharp money — what each move suggests
- Public money (recreational bettors): typically large volume on favorites, public teams and popular leagues. Moves driven by public money often widen lines in the favorite’s direction but can create value on the underdog.
- Sharp money (professional bettors / syndicates): smaller, targeted stakes placed quickly. Sharp-driven moves are usually respected by bookmakers and frequently followed by line tightening or limits.
Practical check: if a line narrows heavily within minutes and limits are lowered, that often indicates sharp activity.
Sport-specific examples
- Football: A red-card or late injury in the starting lineup can swing the moneyline and handicap quickly. An initial move from 1.95 to 1.70 after injury news signals informed staking.
- Tennis: Early line movement pre-match often reflects surface preference or withdrawal news. In-play momentum changes (serve breaks) cause rapid live-odds shifts; liquidity is lower on small tournaments, so moves can be exaggerated.
- Basketball: High liquidity and many micro-markets mean books can absorb sharp action, but late scratches and foul trouble drive fast line changes; point spread moves of more than 2 points before tip-off are worth investigating.
Step-by-step method to spot value from line shifts
- Record the opening line across several books and calculate implied probabilities (convert odds to %).
- Monitor timing and magnitude of moves — big, fast moves often indicate sharp money; slow, popular-driven moves suggest public influence.
- Cross-check news feeds: injuries, coach changes, starting lineups or weather should explain the move; unexplained moves deserve closer scrutiny.
- Compare against a personal model or consensus market price. Value exists when implied probability < model probability after accounting for remaining vig.
- Watch liquidity and limits: if a bookmaker limits maximum stakes or retracts lines, treat that as a sign of professional concern.
The next section will unpack how automated pricing algorithms and exchange liquidity react in seconds during in‑play events and how to convert those reactions into trading rules.
How automated pricing and real‑time feeds drive in‑play moves
In modern markets most live moves are executed by algorithms: bookmakers’ risk engines, market‑making bots on exchanges, and third‑party pricing feeds ingesting event data (lineups, goals, serve outcomes) with millisecond timestamps. These systems don’t “decide” like humans — they apply rules based on models and available liquidity. That explains two common patterns you’ll see in live markets:
– Immediate spike then decay: an event (goal, break of serve, injury) triggers a quick, often overshooting price change as automated books protect liability. A second wave of adjustment follows when liquidity providers and exchange market makers rebalance.
– Laddering and steam moves: when multiple sharp bets hit a side, the automated engine tightens lines progressively (laddering), which can be mistaken for organic informational moves.
Practical checks to read automated moves
– Source and latency: check whether the book gets official feeds directly or via a third party — lower latency sources move first. If one book shifts ahead of the market, expect the rest to follow.
– Magnitude vs event context: compare the size of the move to the underlying change. In football a late equaliser should create a larger implied probability swing than a peripheral yellow card. Disproportionate moves often indicate liquidity pressure rather than new information.
– Limits and bet acceptance: automated limits being applied (rejected bets, reduced max stakes) is a stronger signal of true sharp exposure than odds movement alone.
H2 should be used only for headings — continuing with the next section below.
Turning in‑play reactions into repeatable trading rules (sport‑specific workflows)
Converting market behaviour into rules reduces emotion and improves ROI. Below are sport‑specific, step‑by‑step methods you can implement.
Football — post‑goal scalps and overshoot plays
1. Record pre‑match mid‑market and expected win probability from your model.
2. After goal, watch exchange depth: if market offers much higher skew than model (overshoot), place a small back on the disadvantaged side and lay out at a tighter spread as lines normalize.
3. Time filter: allow 20–90 seconds for automated corrections; shorter in fast markets, longer in low‑liquidity leagues.
Tennis — serve breaks and momentum windows
1. Monitor serve‑specific markets (next game, next point) as proxies for match momentum.
2. When a break occurs early in a deciding set, compare live match probability shift to historical median for that situation. If the move exceeds the median by X% (calibrate X from backtests), consider a contrarian entry anticipating mean reversion.
3. Be cautious in small tournaments — low liquidity amplifies noise.
Basketball — run detection and live spread trades
1. Use a running expected‑points model (time remaining + possession + fouls) to produce an in‑game spread.
2. When a 6–12 point swing occurs quickly, check bookmaker spread against your model and exchange mid‑price. Rapid public money can overreact; fade small overreactions with tight stakes.
3. Hedge with totals or player props to manage sudden lineup changes.
General rules across sports
– Size stakes to liquidity and speed: smaller, faster markets require lower stake-to-limit ratios.
– Track reaction patterns per bookmaker — some over‑react consistently; others tighten only to sharp action.
– Always cross‑check news feeds for legitimacy; automated engines react to feeds, not rumours.
These rules make the mechanical behaviour of algorithms and liquidity work for you rather than against you — the next step is backtesting thresholds and timing to your own bankroll and latency profile.
Backtesting, bankroll and execution checklist
- Define clear entry and exit rules for each rule set (pre-match value, post-goal scalps, serve-break contrarian trades, etc.).
- Backtest those rules over representative historical samples and record edge, variance and max drawdown.
- Calibrate stake sizes to both your edge and market liquidity — use fractional Kelly or fixed-percentage sizing and cap size by available liquidity per bookmaker/exchange.
- Track latency and data sources; log timestamps of price changes, bets placed and bet acceptance/rejection to spot execution slippage.
- Maintain a short post-session reconciliation: wins/losses, rule deviations, unusual market behaviour and any news that altered expected outcomes.
- Iterate thresholds (time windows, overshoot percentages, model tolerances) only after statistically significant backtest results — avoid curve‑fitting to a single surprise move.
Turning market mechanics into repeatable discipline
Understanding why lines move is useful only when it feeds a repeatable process. Build simple, testable rules; protect capital with disciplined sizing; and treat market signals as probabilistic inputs, not certainties. Automate what you can (tracking, feeds, bet logs) and keep the human role focused on interpretation, risk control and continual refinement. Over time, that disciplined approach — not a single clever trade — is what turns knowledge of book mechanics into a lasting edge.