
 By Christian Hayes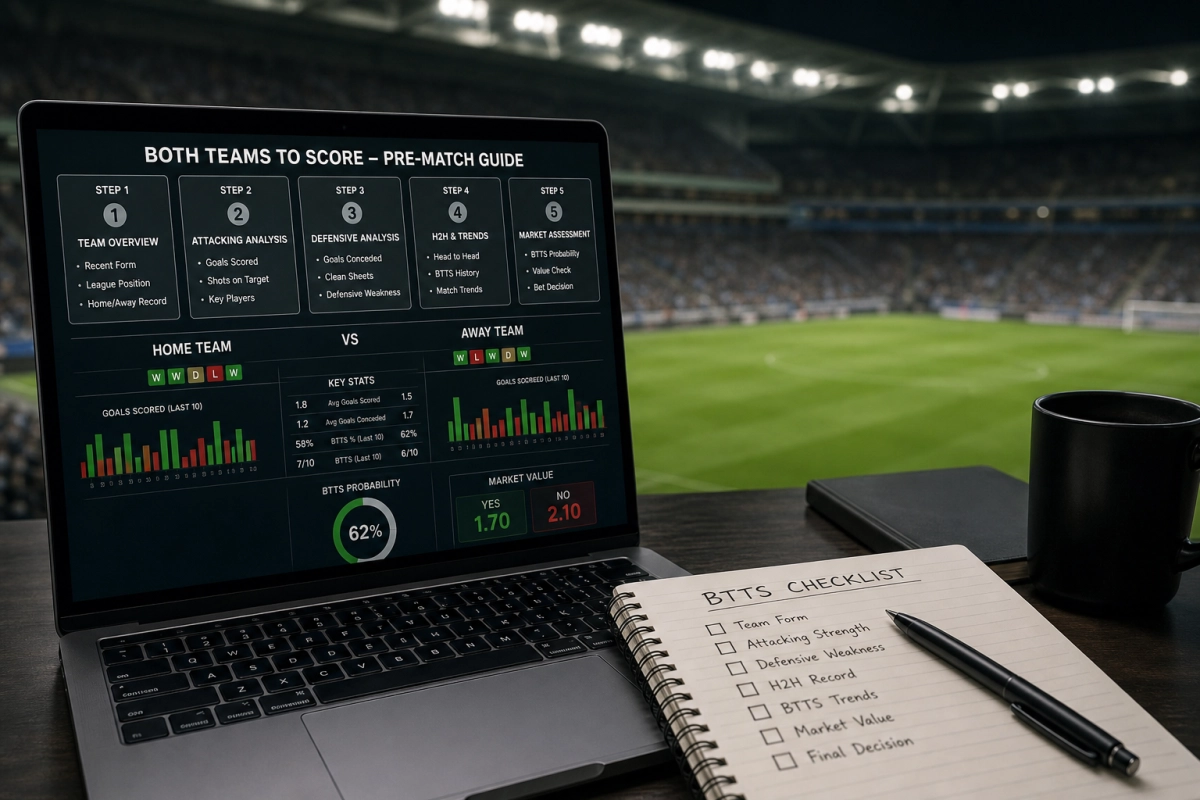
How to assess the both teams to score market before kick-off
Both teams to score (BTTS) asks whether both sides will score at least once. This guide explains why BTTS is a viable market, introduces six indicators for pre-match assessment, and walks through worked examples, implied-probability checks and concise staking guidance so you can make repeatable, disciplined decisions.
Why use a structured six-indicator approach for BTTS
A checklist reduces guesswork. The six indicators used here are: scoring form, defensive records, tactical style, head‑to‑head, injuries/suspensions, and situational motivation. Combined they give a practical probability estimate you can compare with bookmaker odds to spot value.
Quick definition and odds context
BTTS “Yes” means both teams score. Bookmaker decimal odds convert to implied probability: implied = 1 / decimal odds. If your estimated probability exceeds the implied probability, the selection may offer value.
Indicator 1 — scoring form: how often teams find the net
Scoring form measures how often each team scores in recent matches. A simple metric is “matches with at least one goal” over the last 8–10 fixtures.
- Example: Riverside scored in 8 of last 10 → 80%.
- City United scored in 7 of last 10 → 70%.
Assuming independence, multiply the two rates: 0.80 × 0.70 = 0.56 → 56% baseline BTTS estimate from scoring form alone. This is a practical starting point; the other indicators will adjust it.
Indicator 2 — defensive records: how often teams concede
Defensive records show how often teams concede at least once. Use the same look-back window and express as a conceded rate.
- Riverside conceded in 6 of 10 → 60%.
- City United conceded in 9 of 10 → 90%.
A pragmatic way to combine offense and defense is to average a team’s scoring rate with the opponent’s conceded rate as that team’s chance of scoring in the match:
Riverside scoring chance = average(80%, 90%) = 85%.
City United scoring chance = average(70%, 60%) = 65%.
Estimated BTTS = 0.85 × 0.65 = 55.25%.
Compare to market and simple staking guidance
If the bookmaker offers BTTS Yes at 1.80 (implied 55.6%), the market and the 55.25% estimate are similar—no obvious value. If the market is 2.20 (implied 45.5%), the model suggests value: estimated 55.25% > implied 45.5%.
Staking: beginners should use flat stakes (1–2% of bankroll). For those using Kelly, prefer a fractional Kelly (½ or ¼) to account for model uncertainty. Always cap single bets and avoid increasing stakes after losses.
Indicator 3 — tactical style: how play patterns push BTTS up or down
Tactical style captures whether teams play attack‑leaning, balanced, or defence‑leaning football. Use simple box‑score metrics (shots, shots on target, possession) and match reports to classify style.
- Example: Riverside — high shots (18/game), attack‑leaning. City United — moderate shots but vulnerable on counters → balanced-to-attack.
Convert style into an adjustment: if both sides are attack‑leaning or one attacks and the other is vulnerable, add ~4–7 percentage points to the baseline. If one is clearly defence‑leaning and effective, subtract ~5–10 points.
Applying +7 points to the defensive-adjusted baseline (55.25%) → ≈62.25% (round to 62%). This acknowledges that tactical openness increases mutual scoring risk beyond raw rates.
Indicator 4 — head‑to‑head: patterns, anomalies and psychological edges
Head‑to‑head (H2H) can reveal repeatable patterns. Use the last 6–8 meetings and note BTTS frequency and any outliers (red cards, weakened teams).
- Example: Last 6 meetings: BTTS in 4 → 66.7% H2H BTTS frequency.
Blend H2H with the running estimate but weight recent form more heavily. A practical mixture is 70% model estimate and 30% H2H: 70% × 62.25% + 30% × 66.7% ≈ 64.1% → final pre-match BTTS ≈ 64% at this stage.
Worked update and simple staking guidance
Final estimated BTTS probability at this point: ≈64%. Compare to market odds by converting to implied probability. If bookmaker odds are 1.80 (55.6%), edge ≈ 8.4 percentage points — clear value. If 2.10 (47.6%), edge is larger.
Staking rules reminder: use flat stakes for small edges, fractional Kelly for larger but uncertain edges, and cap single bets (e.g., ≤5% bankroll). Track every bet and the reasoning behind it to calibrate your model.
Indicator 5 — injuries and suspensions: available personnel and match impact
Player absences often change probabilities more than raw form. Focus on absences that affect goal creation or prevention: key strikers, creators, full-backs who cross, goalkeepers and central defenders.
- Rule of thumb: remove ~8–15 points from a team’s scoring chance for a key forward absence; remove ~6–10 from conceding probability if a central defender/keeper is out. Small changes (2–5 points) for rotation or fringe players.
Worked adjustment (Riverside vs City United): if Riverside’s top striker is out (−10 points) and City United’s creator doubtful (−6 points), the BTTS estimate can fall substantially. Best practice is to recalc each team’s scoring probability and multiply rather than simply subtracting from the BTTS total; illustrative shortcut moves the blended estimate from ~64% toward ~50–52% depending on replacements.
Indicator 6 — situational motivation: context that tilts behaviour
Motivation and context—league position, cup priorities, derby intensity, fixture congestion, travel—tilt risk‑taking versus conservatism.
- High mutual motivation → add 3–8 points to BTTS.
- Motivation mismatch (rotation, dead rubber) → subtract 4–8 points.
- Fixture congestion/tiredness → subtract 2–6 points unless both rotate similarly.
Worked adjustment: if both sides are pushing for table position and will field strong XIs despite injuries, a +5 point motivation bump could lift an injury‑adjusted BTTS around 50% back to ≈55%.
Final worked update, market check and disciplined staking
Combine the six indicators methodically rather than stacking ad hoc adjustments. A practical workflow:
- Compute a baseline from scoring and conceding rates.
- Apply a tactical style modifier.
- Blend in H2H (e.g., 70% model / 30% H2H).
- Recalculate team scoring chances after injuries/suspensions and derive BTTS multiplicatively.
- Apply situational motivation adjustments.
Using the Riverside example: baseline and style/H2H blend gave ≈64%. Injury downgrades moved that toward ~50%, while motivation nudged it back to ≈55%. Compare this final estimate to bookmaker odds to determine edge: a market at 1.90 (implied 52.6%) yields a small edge (~2.4 points) suitable for conservative stakes; 2.10 (implied 47.6%) is a clearer value.
Staking checklist:
- Flat stakes (1–2% of bankroll) for small edges.
- Use fractional Kelly (½ or ¼) when applying Kelly sizing.
- Cap single‑match exposure (e.g., ≤5%) and never chase losses.
- Record every bet and the indicators that led to it for ongoing calibration.
Putting the six‑indicator checklist into practice
BTTS is a market where modest, repeatable edges produce long‑term returns. Use the six indicators as a checklist: start with scoring/conceding data, layer in tactics, test H2H patterns, then apply personnel and context adjustments. Be explicit about how many percentage points you add or subtract at each step and keep a simple spreadsheet of estimates versus market odds.
Discipline matters more than clever heuristics. Small, well‑recorded adjustments and conservative staking let you learn which indicators matter most for the competitions you follow. Over time you can refine weights, automate routine calculations, and focus on markets where your process yields a consistent edge.